I’m thrilled to announce the launch of my new iPhone and iPad app, Chat-R (pronounced “chatter”), now available on the iOS App Store! If you’ve ever wanted to learn R programming but found traditional methods daunting, Chat-R offers a fresh, engaging, and interactive approach.
Main screen of Chat-R.Opening texts from your own Professor!Texting with the Professor for personalized dialogue.Test your skills!
Learn R Through Conversation
Chat-R transforms the learning experience by simulating text-based conversations with a virtual R professor. Instead of passively reading textbooks or watching videos, you’ll actively participate in Q&A sessions, receiving detailed explanations and feedback as you progress.
Master R at Your Own Pace
Whether you’re a complete beginner or looking to brush up on your skills, Chat-R provides a structured, step-by-step learning path. You’ll cover essential R topics, including:
Basic syntax and data structures
Data manipulation techniques
Plotting and visualization
And much more!
Immerse Yourself in Interactive Learning
Chat-R goes beyond simple definitions. It provides:
Contextual Explanations: Understand the nuances of R commands with clear, line-by-line breakdowns of console interactions and real-world code examples.
Practical Examples: Explore how R is used in practice with hands-on examples and dataset manipulation.
Key Features:
Conversational Learning: Engage in interactive text-based dialogues with a virtual professor.
Console Output Explanations: Decipher R’s output with detailed explanations of prompts, indices, and results.
R Function Deep Dives: Gain in-depth knowledge of essential R functions.
Data Handling Examples: Work with data frames, vectors, and matrices using practical datasets.
Clear and Concise Explanations: Benefit from easy-to-understand explanations of R concepts.
Your Privacy Matters
I also want to emphasize that Chat-R does not collect any user data. Your privacy is important, and you can learn R with complete peace of mind.
Ready to Start Your R Journey?
Chat-R is the perfect pocket companion for anyone eager to learn R programming in a fun and interactive way. Download it today from the iOS App Store and begin your conversation with R!
One of the projects I’ve been working on during the winter break of 2024/2025 is a video game for getting started with R. I’m usually thinking of new ways to communicate and share knowledge during my spare time. I’ve written a website (RGalleon.com), written a textbook (An Introduction to R for Non-Programmers), and taught short courses and in university setting on various aspects of R, Python, and/or SQL.
Developing the Video Game
However, I’ve been noticing that many of my students are now on their phones – all the time! I tried to think of a way that I could connect and share my expertise with those individuals better. In the summer of 2024, I tried developing an app, but it got put on the backburner. However, I buckled down during the winter break and made some serious progress. I tried my hand at Ren’Py, as it is python-based. This made it much easier for me to develop the video game as I already know python, so the syntax was easier for me to pick up and learn over other video game engines. Ren’Py also has a feature that exports your work to XCode for iOS development. (It has some small bugs when porting the game, but does so much of the work that it is still VERY helpful.) At this point, I have a game that works and has the main functionalities that I want.
Below is the opening screen:
The Basic Look and Functionality
Once the user starts the game, they will see a screen that looks like this:
The goal of the video game was to look like a phone texting conversation. I am hoping that it makes folks on their phones a lot more comfortable with the experience. By pressing the play icon, the user can progress the conversation. At certain points, the user will have different options to select. Their choice will prompt potentially different responses. Below is an example of the user’s message and the subsequent responses:
Since the app doesn’t have R built into it, I decided to include images of output so that the user can see what code will look like in R. Here’s an example of that:
The user will be presented with questions throughout the conversation. During these points, the user will have to make different choices. If the user makes an incorrect choice, the Professor character will explain why the choice is incorrect, and will give the user another chance to select the right solution. Once the user selects the right answer, the user will be able to progress.
Looking Forward
At this stage, I am still working out some kinks and polishing the game up (i.e., removing some buttons, including a tutorial for navigation, etc.). I hope to be able to release is during the first quarter for 2025 – so please stay tuned! 🙂
Disclaimer: Before making any investment decisions based on this (or any financial content on the internet) analysis, consult with a financial professional (https://www.youtube.com/watch?v=ILsXSJeF9Xc). This blog post is for informational and educational purposes only.
In the world of investing, choosing the right index fund can be a daunting task. Two popular options are the Dow Jones Industrial Average (DJIA or sometimes abbreviated here as DOW) and the S&P 500. This post explores their historical performance to see if one might be a better choice. If you are interested in learning how to perform analyses like this, consider one of my data science courses: https://wp.me/P5xMk4-5p
Methods
We utilized different methods to compare and contrast the indexes. Some of these were traditional, such as computing helpful summary statistics of the returns (such as the average return). We also calculated different moving averages as a useful benchmark to obtain medium to long term performance.
We also performed a more sophisticated approach to understand the returns of both indexes called the bootstrap. To understand the bootstrap, imagine you have the historical return data for both the Dow Jones and the S&P 500. The bootstrap algorithm is a fancy way to create many “fake histories” of returns, helping us understand how reliable the statistics we calculate from the real data might be.
Here’s how it works:
Resampling with Replacement: Think of randomly grabbing returns from your data/historical returns/history, but with a twist: you can put them back in each time! This allows you to create a new “fake history” with potentially duplicate years.
Creating Many Fake Histories: We repeat this grabbing and replacing process hundreds of thousands of times, creating a whole collection of these “fake histories” for both DJIA and S&P 500. Each fake history has the same number of years (like 30) for each run, but the order and sometimes even the specific years might be shuffled around.
Analyzing Each Fake History: Now, for each fake history, we calculate statistics like average return, just like we did with the real data. This gives us a sense of how much these statistics would vary if things like random chance influenced which years we picked. From these statistics, we can even describe the distributions of these statistics.
Why it’s Useful for Comparing Distributions:
By repeating this resampling process a large number of times, the bootstrap generates a distribution of summary statistics (mean, median, standard deviation etc.) for both DJIA and S&P 500 returns. This allows you to:
Compare Variability: Analyze how much the summary statistics (like mean return) vary between the two indexes. A wider spread in the bootstrap distribution suggests more variability in the statistic.
Distribution Shape: Visualize the distribution of these statistics using techniques like histograms or density plots. This can reveal if one index has a more skewed distribution of returns compared to the other.
By comparing the bootstrap distributions of the DJIA and S&P 500, we’ll gain a deeper understanding of how consistent their returns are, how much they might fluctuate, and any potential differences in their return distributions. If you are interested in learning how to perform the bootstrap in situations like this, consider my data science bootcamp: https://wp.me/P5xMk4-5p
Initial Analysis
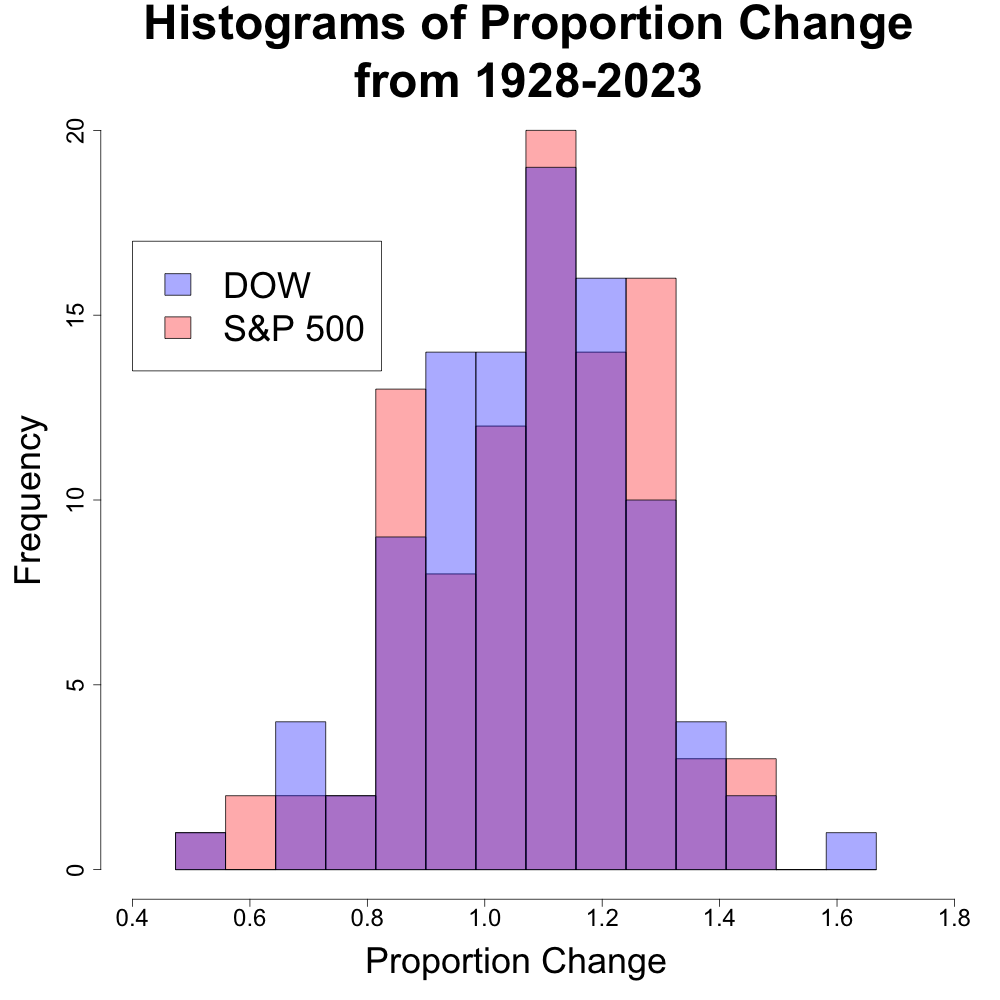
We compared the annualized historical returns of the DJIA and the S&P 500 over the same time period (1928 to 2023). While initial plots suggested the Dow Jones might even outperform the S&P 500, further analysis revealed a different story. The code and output from this analysis is provided at my GitHub link: https://github.com/billyl320/sp500_dow_compare
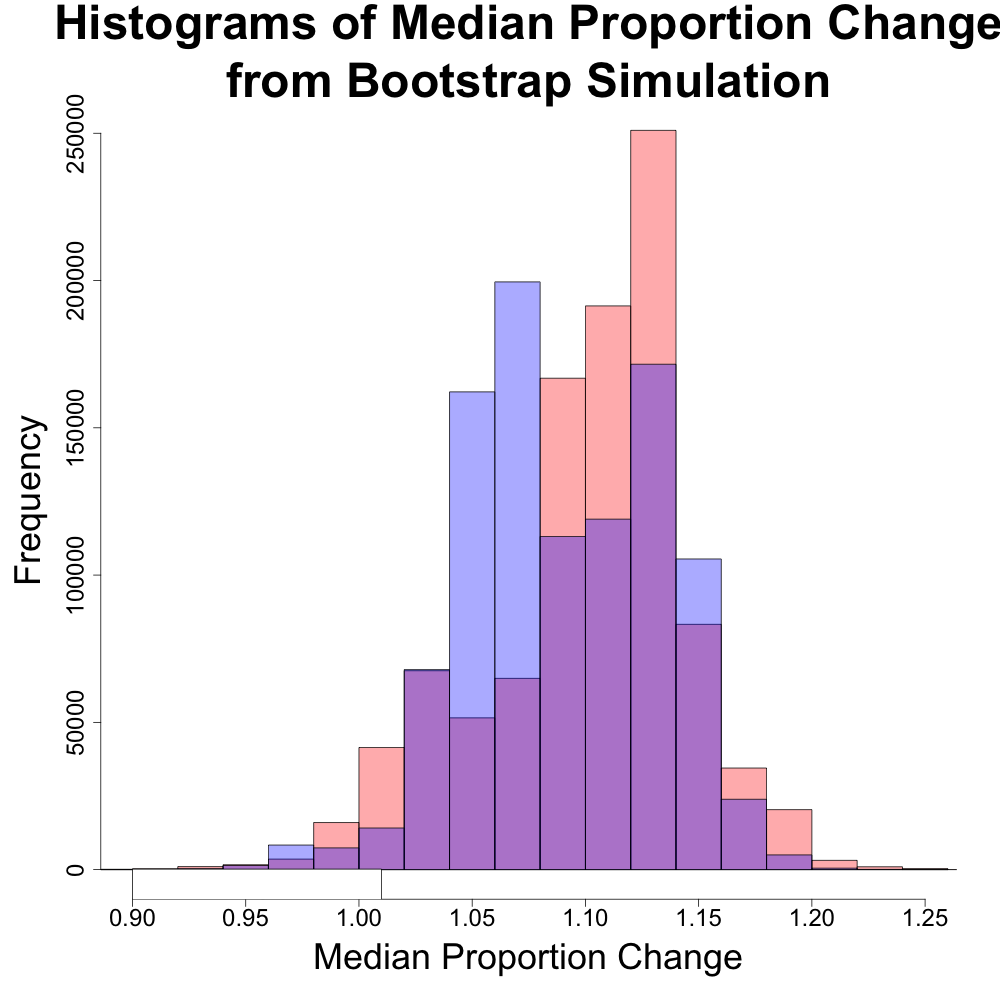
The above plot represents the returns as “proportion change”. Proportion change is defined to be the annualized return change. For instance, a return of 40% would equate to a proportion change of 1+0.40 = 1.40. A return of -40% would equate to a proportion change of 1-0.40 = 0.60. We can see that the histograms of the proportion change is fairly similar. There is even an (albite very very unlikely) chance that the DJIA may have years of the greatest return due to have the maximum value across both indexes.
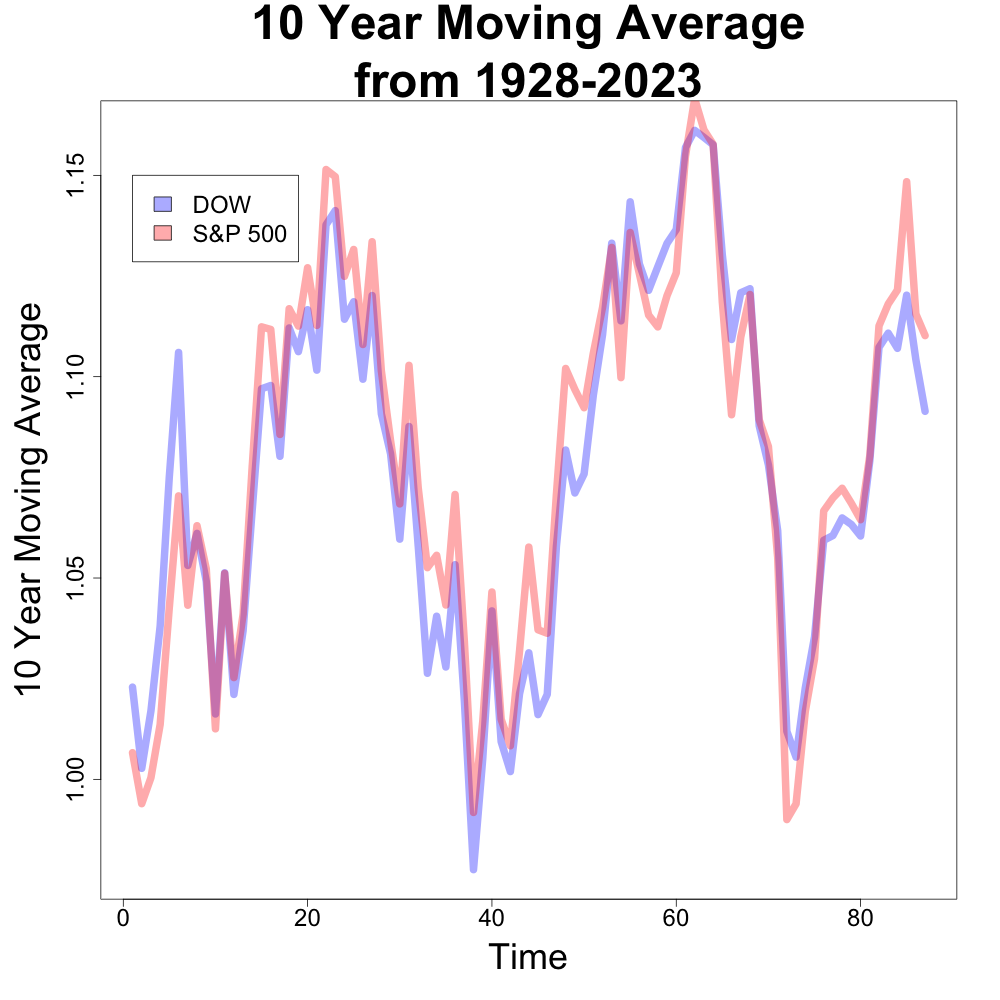
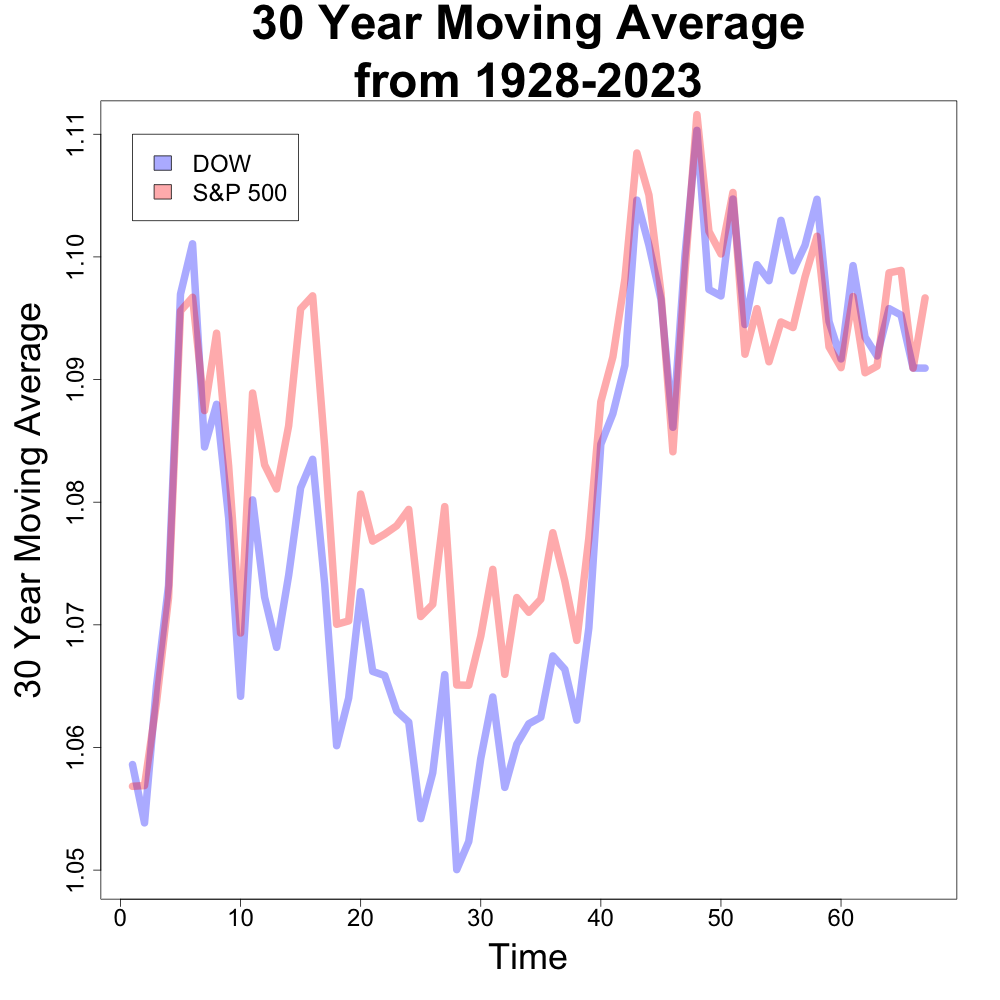
Average Returns Are Similar
Financial experts often cite similar average returns for both indexes across different time periods [1, 2, 3]. Our analysis confirms this. While both indexes have experienced periods of strong growth and decline, their long-term average returns tend to be close. Below are the 10 year and 30 year moving averages of both indexes. (This is especially true in more recent years.) The x axis is time where the larger values indicate more recent years.
Median Returns Tell a Different Story
However, looking deeper, we found a larger difference in the medians. Recall that the median represents the “middle” value in a dataset, where half is less than the median and the other half is greater. The average or mean does not guarantee to have half of the data on either side of it.
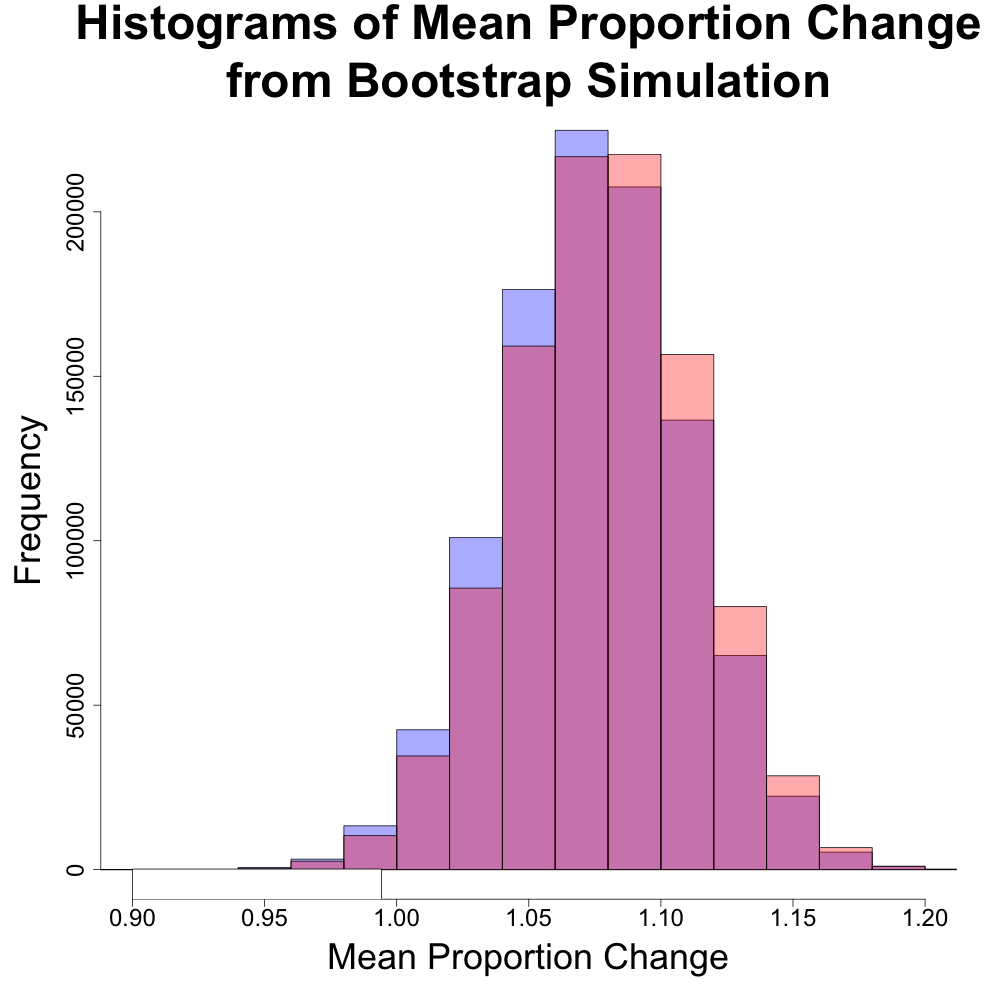
The above histogram compares the distributions of the means of the DJIA and S&P 500 (in blue and red, respectively). The distributions are very similar and would suggest that either index would give similar rates of performance.
The above histogram compares the distributions of the medians of the DJIA and S&P 500 (in blue and red, respectively). The distributions are very different and would suggest that either index behaves differently. The DJIA has two peaks, one closer to a 5% annualized return and one closer to 15%. The S&P 500 has one primary peak around a 15% annualized return. This suggests that it is more likely to have higher returns with the S&P 500 than the DJIA, despite having a similar range for the median.
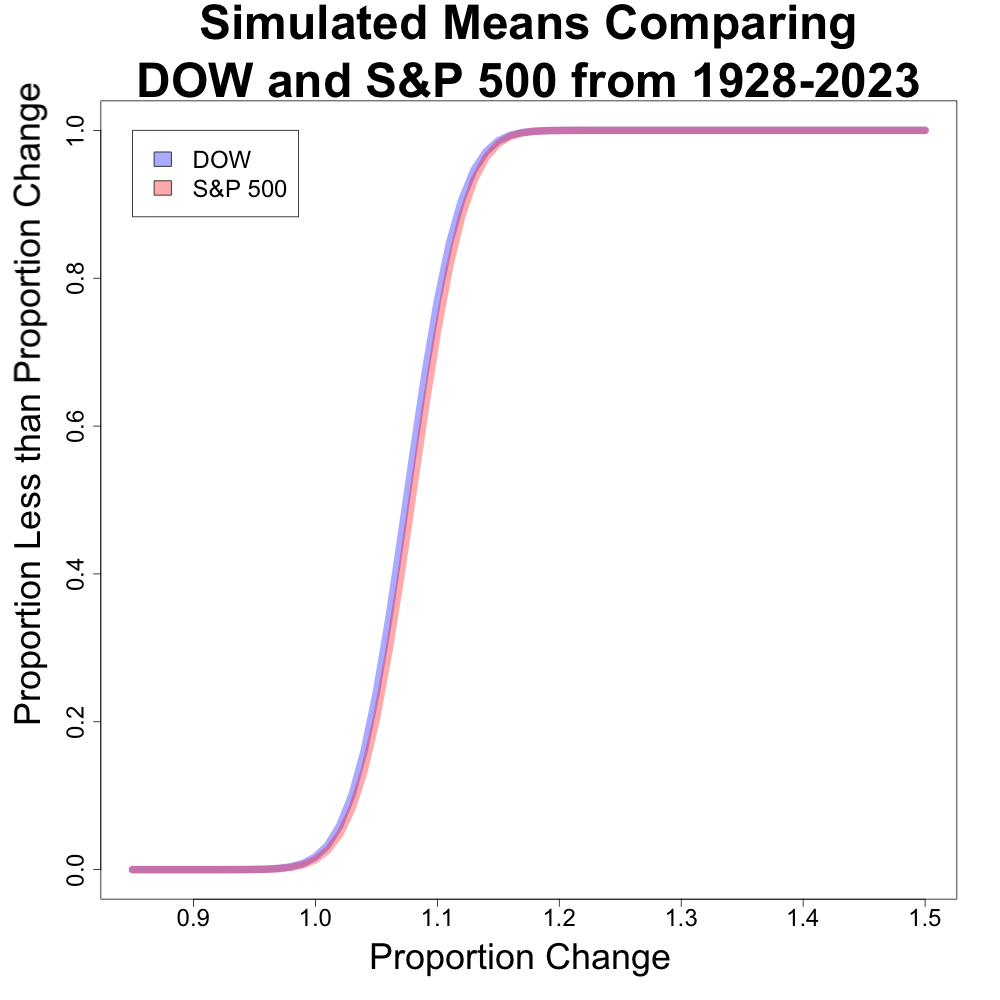
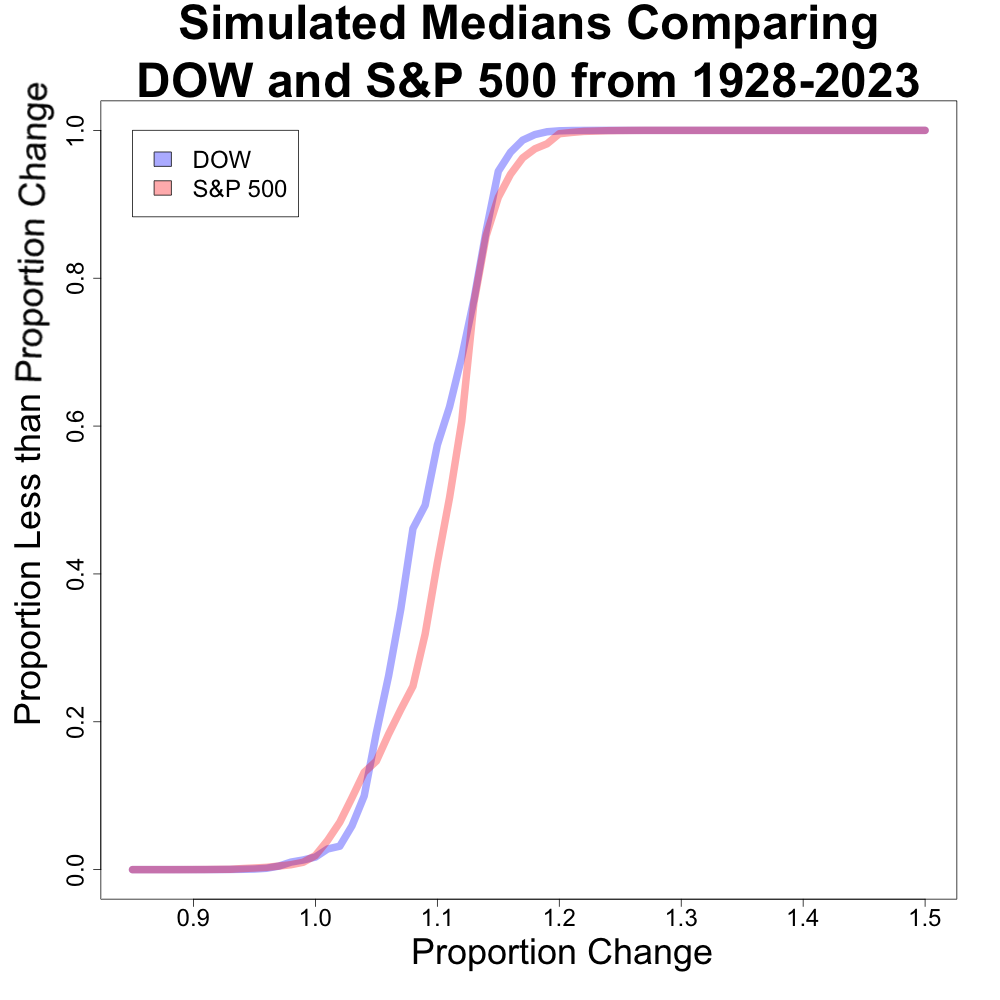
This got me thinking, “Is there a good way to represent how different these distributions are?”. I created a plot comparing the proportion of medians less than a given value for both of these (this is very similar to an estimated CDF plot). I first looked at this plot for the means, and then the median.
The plot for the means are very similar with no noticeable differences in the plot. Generally speaking, we would expect a better performing index to have a line closer to the x axis for a longer stretch of proportion change.
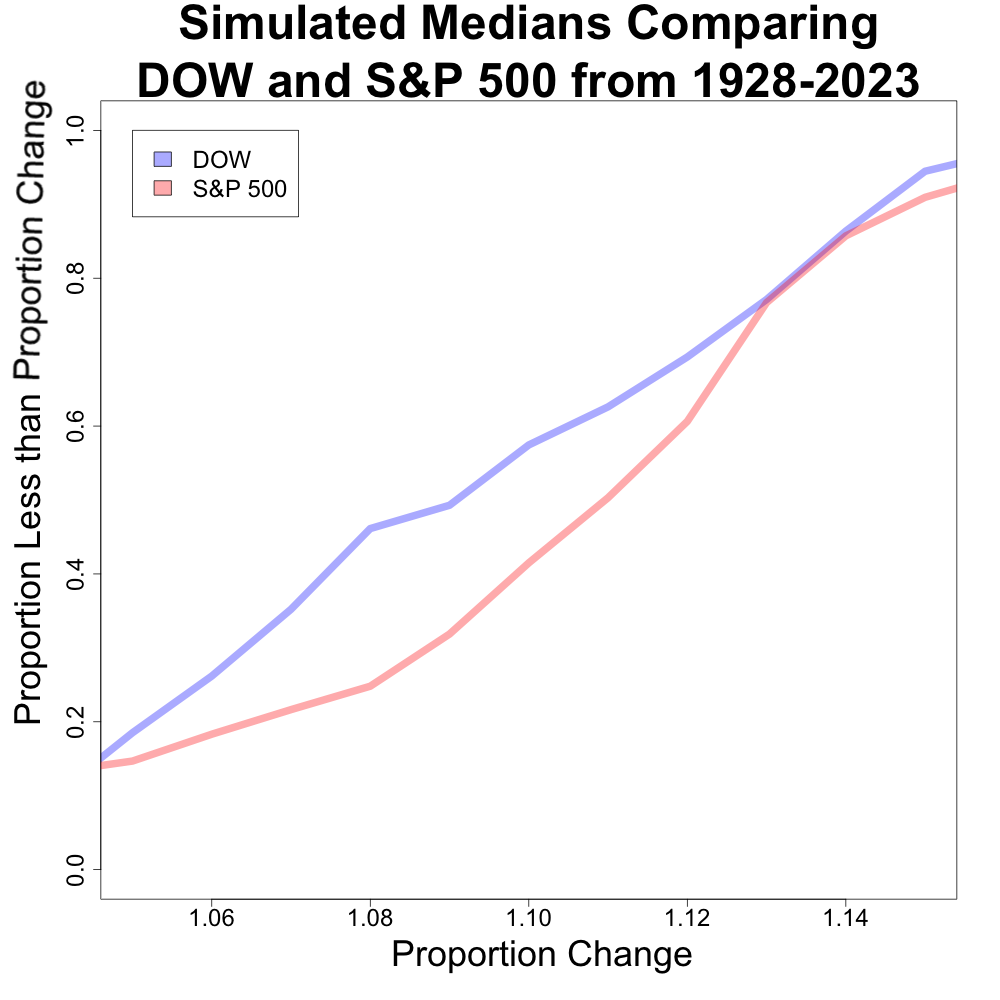
However, when we look at the median counterpoint, we can see some deviations between the x axis values of about 1.06 to 1.14. The next plot looks as a zoomed in section of this part of the plot.
This plot shows that there is a large discrepancy between the two indexes. For example, the distribution of the S&P 500 median has less than 20% of its distribution less than 8%. Conversely, the distribution of the DJIA median has over 40% of its distribution less than 8%. The distributions begin to converge after 1.14.
So, Which Index is Better?
Based purely on historical data and risk tolerance, the S&P 500 appears to be the better choice. Here’s why:
More Consistent Growth: The distribution of the S&P 500’s median return suggests steadier growth potential since it only has one major peak.
Greater Diversification: The S&P 500 tracks 500 companies, offering broader diversification compared to the Dow Jones’s 30 companies.
Are There Reasons to Choose the Dow Jones?
While the S&P 500 might be the analytical favorite, there are potential reasons to consider the Dow Jones:
Social Investing: An investor might have issues investing in many of the companies in the S&P 500. Investing in the DJIA might provide a list of less problematic companies for the investor.
Easier for Self Management: It also might be easier to create a self-driven portfolio without using investment products like ETFs using the DJIA than the S&P 500.
Potential for Higher Returns (with Higher Risk): The Dow Jones has experienced some periods of higher returns than the S&P 500 (as due to the one year with outsized returns for the DJIA in the historical data). However, this comes with the risk of larger potential losses.
The Final Word
The “better” index depends on your investment goals. If you prioritize consistent growth and diversification, the S&P 500 might be ideal. However, if you’re comfortable with potentially higher risk for potentially higher rewards, the Dow Jones could be an option.
Is there anything that I didn’t consider that you would have? Anything that you might have done differently? Let me know and perhaps I can do a follow up to this!
Remember: Regardless of which index you choose, consulting with a financial professional is crucial before making any investment decisions. They can help you create a personalized investment plan that aligns with your financial goals and risk tolerance.
Artificial intelligence (AI) is the buzzword of the past year or so. From personalized shopping recommendations to self-driving cars, it feels like AI is infiltrating every facet of our lives. But with this ever-growing presence comes a critical question: is AI dangerous?
Defining the Beast:
First, let’s be clear what we’re talking about. AI isn’t some omnipotent robot overlord (*laughs nervously*). It’s a broad term encompassing algorithms that can learn and make decisions without the need for human inputs. These algorithms range from simple recommendation engines to complex systems powering medical diagnosis. The FDA has also thought about these ideas for a number of years at this point and AI’s application to medical devices.
The Good, the Bad, and the Algorithmic:
AI undeniably offers countless benefits. It streamlines processes, automates tedious tasks, and even has the potential to help save lives. But beneath the gleaming surface lie potential pitfalls. One key concern is the cost of AI mistakes (I talk about this idea a bit in my textbook chapter which is available as a paperback at this affiliate link). When an algorithm makes an error, the consequences can range from mild annoyance (a bad movie recommendation) to catastrophic (a misdiagnosed illness).
Example 1: Level Up, Game Over?
Consider the world of video games. AI-powered opponents are becoming increasingly sophisticated, offering a more realistic and challenging experience. However, a poorly designed AI could lead to frustrating, unfair gameplay, pushing players away. The AI could even make a benign error making the environment in a particular scene look jarring, taking away from the immersive experience players expect. This, while not world-ending, demonstrates the importance of responsible AI development to ensure positive user experiences. However, in the grand scheme of things, making an AI making a mistake doesn’t directly result in catastrophic results. Maybe the water doesn’t look exactly right, but it’s not like someone died. (Quick aside: If a game was so buggy and unplayable due to a reliance on a bad AI, a team or company could all lose their respective jobs which would be a severe downside.)
Example 2: National Security on Auto-Pilot?
Now, the stakes get higher when it comes to national security. Imagine AI being used in national security applications, from analyzing intelligence to making critical decisions in high-pressure situations. While AI can process vast amounts of data and identify patterns humans might miss, the potential for unintended consequences is immense. A misattribution of enemy activity or a faulty algorithm triggering an autonomous weapon could have devastating real-world repercussions. DARPA has been thinking about how to utilize AI in an explainable and safe manner for a number of years. Claiming that AI will solve all of our problems is a lofty claim, as implementing solutions in high stakes scenarios is extremely challenging.
Conclusion: Not Monsters, but Tools
So, is AI dangerous? The answer isn’t a simple yes or no. It’s a potent tool, like any technology, capable of immense good and devastating harm. The key lies in responsible development, rigorous testing, and clear ethical guidelines to ensure AI serves humanity, not the other way around. We must approach AI with cautious optimism, acknowledging its potential risks while harnessing its power for a better future.
Note: Bard was used to help write this article. Midjourney was used to help create the image(s) presented in this article.
Welcome, fellow data enthusiasts, to the precipice of a new year! As 2023 gracefully exits stage left, we stand poised on the threshold of 2024, a blank canvas brimming with possibilities. For many, this translates to resolutions, aspirations, and perhaps the ever-present yearning to conquer the enigmatic realm of data science.
This blog post is your armor against the inevitable doldrums, your compass through the labyrinthine world of data, and your ultimate guide to sticking with data science throughout 2024.
Charting Your Course: A Roadmap to Success
First things first, you need a roadmap. Think of it as your personal GPS, guiding you through the dense forest of algorithms and statistical models. There are plenty of excellent resources available online, but I recommend checking out these gems:
DataCamp: Structured learning paths with bite-sized, interactive lessons.
Kaggle: Learn by doing with real-world datasets and a vibrant community of data scientists.
Coursera: Specializations from top universities and industry leaders.
Remember, the perfect roadmap is the one that works for you. Don’t be afraid to customize it, experiment with different resources, and find what ignites your inner data scientist.
Fueling the Fire: Staying Motivated
Data science is a marathon, not a sprint. There will be days when the code doesn’t compile, the models refuse to cooperate, and you feel like you’re banging your head against a statistical wall. But fear not, for even the mightiest data wranglers face these hurdles. Here’s how to stay motivated:
Set achievable goals: Break down your learning into smaller, manageable chunks. Completing these mini-quests will give you a sense of accomplishment and keep you moving forward.
Find your community: Join online communities, forums, or local meetups to connect with other data enthusiasts. Sharing your struggles and successes can be incredibly motivating.
Celebrate the wins: Take the time to appreciate your progress, no matter how small. Did you finally understand the concept of p-values? High five yourself! Baked a machine learning-themed cake? Share it with your fellow data warriors!
Remember your “why”: Remind yourself why you embarked on this data-driven odyssey in the first place. Is it to solve real-world problems? Make a difference in the world? Fuel your passion for data and let it guide you through the tough times.
Sharpening Your Tools: Practice Makes Perfect
Data science is not a spectator sport. To truly master this craft, you need to get your hands dirty. Here are some ways to put your theoretical knowledge into practice:
Work on personal projects: Find a dataset that sparks your curiosity and build something cool with it. Analyze your favorite movie ratings, predict the next stock market trend, or create a tool to solve a problem you face in your daily life.
Participate in hackathons: These timed coding competitions are a great way to test your skills under pressure and learn from other data scientists.
Contribute to open-source projects: Lend your expertise to existing projects and gain valuable experience while giving back to the community.
Remember, the more you practice, the more confident and skilled you’ll become. So, don’t be afraid to experiment, make mistakes, and learn from them. Every line of code, every failed model, is a stepping stone on your path to data science mastery.
Remember, the journey of a data scientist is not a solitary one
We are a community of curious minds, united by our passion for extracting insights from the ever-growing ocean of data. So, let’s embark on this exciting adventure together, armed with our roadmaps, fueled by motivation, and ever-honing our skills through practice. Together, we can conquer the dataverse in 2024 and beyond!
Note: Bard was used to help write this article. Midjourney was used to help create the images presented in this article.
Most popular Christmas songs: Analyze streaming data to find the most listened-to Christmas songs over time, by region, or even by generation. You could even build a model to predict the next Christmas hit!
Gift-giving trends: Use e-commerce data to explore what people are buying the most for Christmas gifts. Analyze trends by age, gender, location, or price range. You could even predict the most popular gifts of the year.
Santa’s logistics: Use geographic data and airspeed calculations to estimate how Santa could possibly deliver all those presents in one night. Consider factors like time zones, weather conditions, and reindeer power!
Evolution of Christmas movies: Analyze movie ratings and release dates to see how Christmas movie trends have changed over time. You could even identify the most popular tropes or predict the next Christmas movie hit.
Visualize Christmas tree ornaments: Use image recognition to categorize types of Christmas tree ornaments, or build a tool that suggests ornament pairings based on color and style.
Identify charitable giving trends: Analyze donation data to see how people’s giving habits change around the holidays. You could explore which causes are most popular or how much is donated overall. Further, you could try to replicate other reports from other analyses and try to explain any similarities/differences you observe.
Now that your creative gears are jingling, it’s your turn to take the reins! If you need some help getting started with model building consider my intro to machine and statistical learning video series. Now – let’s build a collaborative Christmas data empire, one snowglobe-shaped insight at a time! Don’t be shy, data elves – the world needs your festive analytics magic!
Note: Bard was used to help write this article. Midjourney was used to help create the images presented in this article.